Getting Started — En
Introduction
What is D-Tech Core?
D-Tech Core is a free, PC-based Honda ECU diagnostic tool built by DynoTraxx. It connects directly to your motorcycle's Engine Control Unit (ECU) via a standard FTDI USB cable to provide real-time sensor data and fault code management.
The D-tech Core is engineered to address the specific diagnostic requirements of the local small-displacement Honda ecosystem. We believe that essential maintenance and troubleshooting capability should be accessible to every tuner and mechanic.
What Can It Do?
- Live Sensor Dashboard — Real-time monitoring of RPM, TPS, MAP, ECT, IAT, battery voltage, injector timing, ignition advance, and more.
- Interactive Data Graphing — Visual trend analysis over 5–30 second windows to catch intermittent sensor dropouts or electrical noise.
- DTC Scanning & Interpretation — Read stored and current fault codes with plain-English descriptions.
- DTC Memory Clearing — Erase stored error codes and turn off the warning light after repairs.
- Diagnostic Reports — Generate clean and easy to read reports for printing or sharing with customers as "Proof of Work."
- ECU Adaptive Reset — Clear learned values from the ECU, essential after replacing a sensor, major services or engine overhaul.
- Calibrated Readings — See correct sensor values in proper units (°C, V, kPa, %, RPM).
Quick Bike Reference
The software remains fully functional for diagnostics and error clearing regardless of the bike model. D-Tech Core currently identifies the following Honda models. Bike detection is automatic via ECM ID.
| Model | Year |
|---|---|
| RS150R V1 | 2016–2018 |
| RS150R V2 | 2019–2021 |
| RS150R V3 | 2022– |
| RSX 150 | 2021–2024 |
| RSX Winner | 2025– |
| CBR150R | 2021–2024 |
| Dash 125 V1 | 2018–2021 |
| Dash 125 V2 | 2023– |
| Wave 125 V1 | 2018–2020 |
| Wave 125 V2 | 2021– |
| EX5 Dream | 2015–2016 |
| Wave Dash | 2017–2022 |
| Wave Alpha | 2023– |
Hardware Requirements & Setup
What You Need
While the software is free, a physical Diagnostic Kit is mandatory. You cannot communicate with the bike without the correct hardware.
| Item | Description |
|---|---|
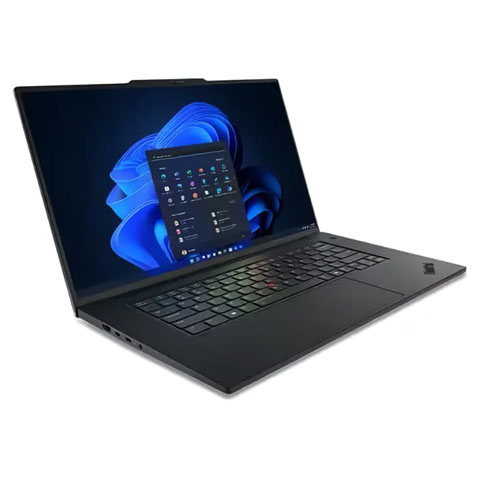
| Windows PC / Laptop | Windows 10 or 11, 64-bit. Acts as the central unit to run the software and process ECU data. |
| FTDI OBD2 USB Cable | Must contain the FT232RL FTDI chip. This is the communication bridge between your PC and the bike's K-Line. |
| Honda DLC Adapter | Converts the OBD2 16-pin plug to the bike's diagnostic port. Two types exist (see below). |
DLC Adapter Types
- Honda DLC Red 6-Pin Connector — For Euro5-compliant and newer models.
- Honda DLC White 4-Pin Connector — For older fuel-injected models.
 Windows 10/11 Laptop
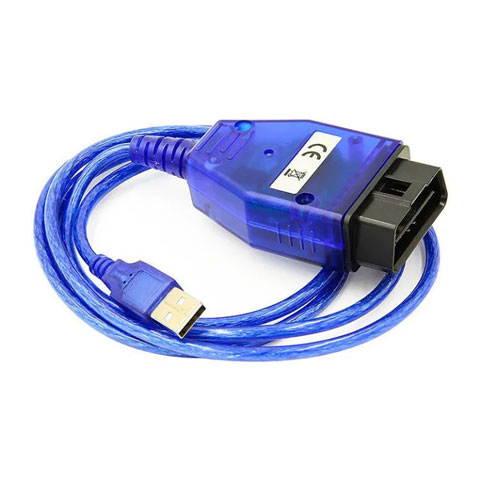 FTDI OBD2 USB Cable
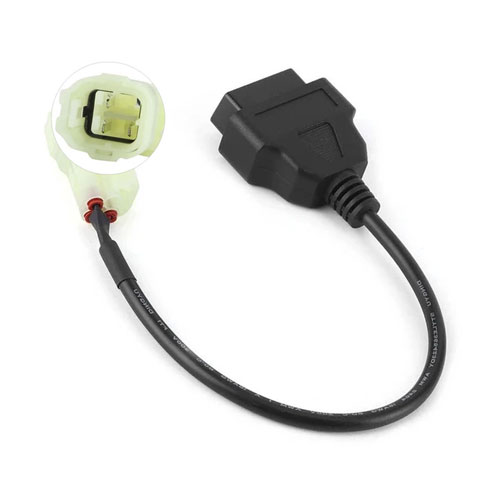 Honda 4-Pin
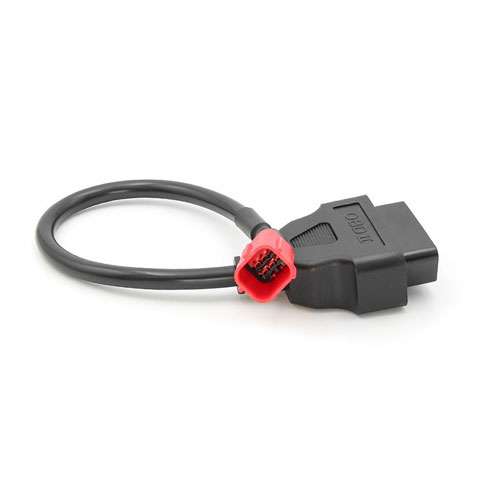 Honda 6-Pin
Download & Installation
Where to Download
D-Tech Core is distributed exclusively through GitHub Releases. Hosting on GitHub ensures trusted, verified delivery and avoids browser security blocks associated with lesser-known download sources.
Installation Steps
-
Download the ZIP
Download the latest
D-Tech_Core_v*_Setup.zipfile from the GitHub Releases page. -
Extract the ZIP
Right-click the file → Extract All. You will see three files: The
main installer
D-Tech_Core_v*_Setup.exe, theVC_redist.x64.exeruntime, and theCDM2123620_Setup.exeFTDI driver.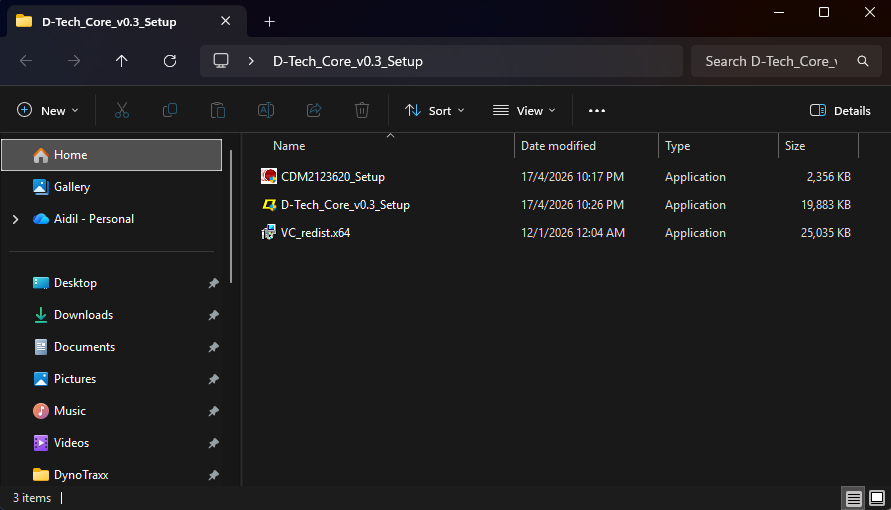
-
Install Drivers & Runtimes (Critical)
Inside your extracted folder, you MUST install the two additional files to ensure
the software will run:
Required for first-time setup:
1. RunCDM2123620_Setup.exeto install FTDI Cable Drivers.
2. RunVC_redist.x64.exeto install C++ Runtimes. -
Run the Setup
Double-click the
D-Tech_Core_v*_Setup.exefile. If Windows warns about "Unknown Publisher", click "More info" → "Run anyway". - Anti-Scam Notice Read the important notice about scam prevention. Click "I understand" to proceed.
- License Agreement Review the license terms. Click "I Agree" to continue.
- Choose Components D-Tech Core (Required) is pre-selected. Optionally add Start Menu and Desktop shortcuts.
-
Choose Install Location
Default:
C:\Program Files\DynoTraxx\D-Tech Core. Change if needed. - Launch Check "Run D-Tech Core" on the finish page and click Finish. You can also launch the program anytime using the D-Tech Core shortcut on your desktop.
FTDI Driver Installation
The FTDI driver allows Windows to recognise the USB cable as a serial device. Most Windows 10/11 systems install it automatically via Windows Update when the cable is first plugged in.
- Plug in the FTDI cable Connect the USB end to your PC. Windows may auto-install the driver.
-
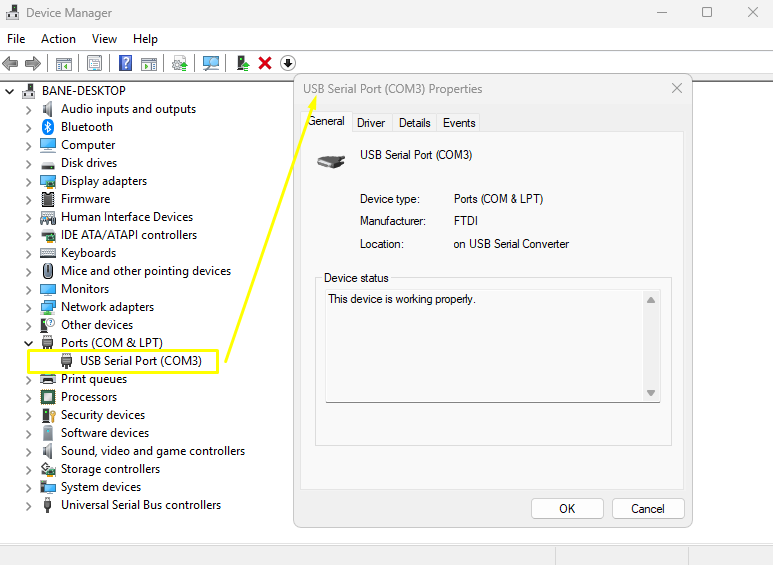
Verify in Device Manager
Open
Device Manager→ expand Ports (COM & LPT). You should see aUSB Serial Port (COMx)entry. -
Manual Install (if needed)
If the device shows a yellow warning icon, run the
CDM2123620_Setup.exefile included in your extracted folder to install the driver manually.
Uninstalling
To remove D-Tech Core from your computer:
- Go to Windows Settings → Apps → search for "D-Tech Core" → click Uninstall.
- Or run
Uninstall.exedirectly from the install directory.
Getting Started
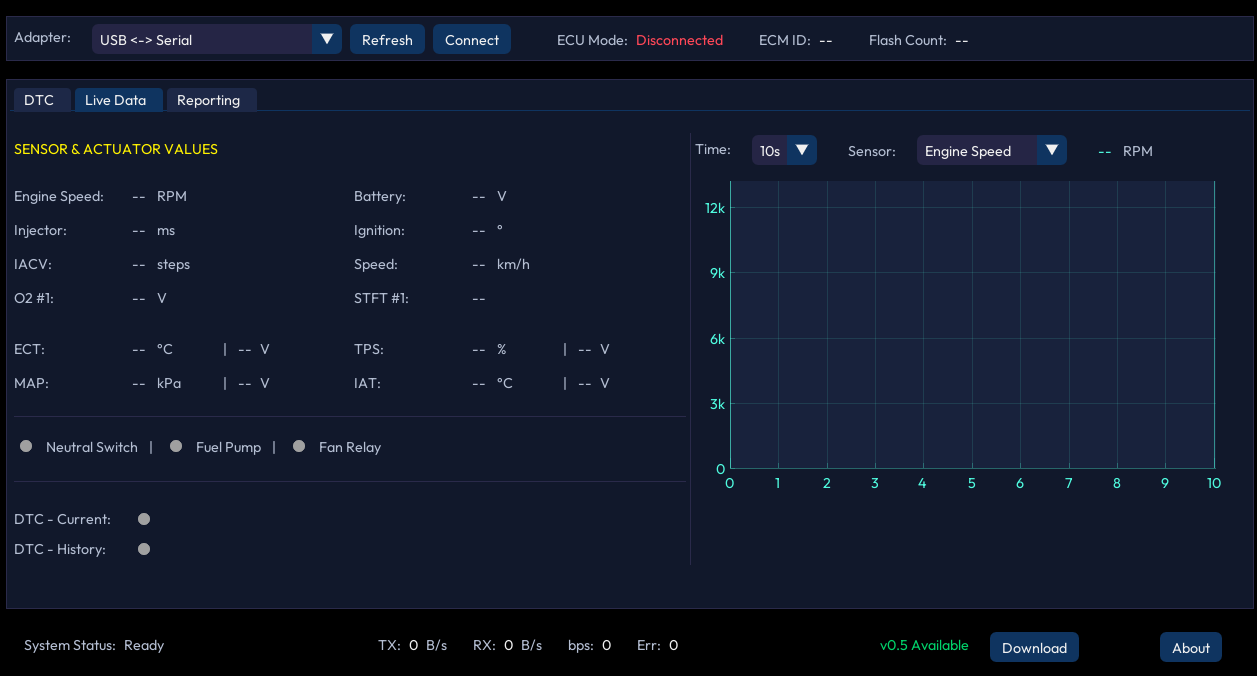
Application Overview
The main window interface elements are as described in the table below:
| Interface Element | Function & Description |
|---|---|
| Adapter Selection | Choose the specific hardware interface or COM port used to link your computer to the ECU. |
| Connect Button | Toggle this to establish or terminate the live data stream between the software and the vehicle. |
| ECU Mode | Displays the current connection state (Disconnected, Initializing, Diagnostic Mode, etc.). |
| ECM Info | Shows the ECM identification number and the write/flash count of the connected ECU. |
| Data Tab Selector | Switch between the DTC view for error codes, the Live Data view for sensors and Reporting. |
| Data Area | The central display for fault codes, live sensor grids, or interactive trend graphs. |
| Bike Model | Automatically identifies the connected motorcycle model based on the ECM database. |
| Data Throughput | Monitor real-time communication speed (TX/RX) and the active baud rate. |
| Update Notification | Alerts you immediately if a newer version of D-Tech Core is available on GitHub. |
| About | View software version information and developer credits. |
Connecting the Adapter to the Bike
- Locate the DLC port The Diagnostic Link Connector is usually located under the seat, near the battery, or behind a side panel. Consult your bike's service manual for the exact location.
- Connect the adapter chain Plug the FTDI OBD2 cable into the DLC adapter (4-pin or 6-pin), then connect the adapter to the bike's DLC port.
- Turn the ignition ON The engine does not need to be running for DTC scanning. For Live Data, you can run the engine or just have ignition ON.
Connecting to an ECU
- Plug in the hardware Connect the FTDI cable to your PC (USB) and to the bike (DLC adapter).
- Turn ignition ON The ECU must be powered. The engine does not need to be running.
- Select the adapter The app auto-discovers connected FTDI devices every 2 seconds. Your adapter should appear in the dropdown automatically.
- Click Connect The status bar will show "Initializing…" as the K-Line handshake begins.
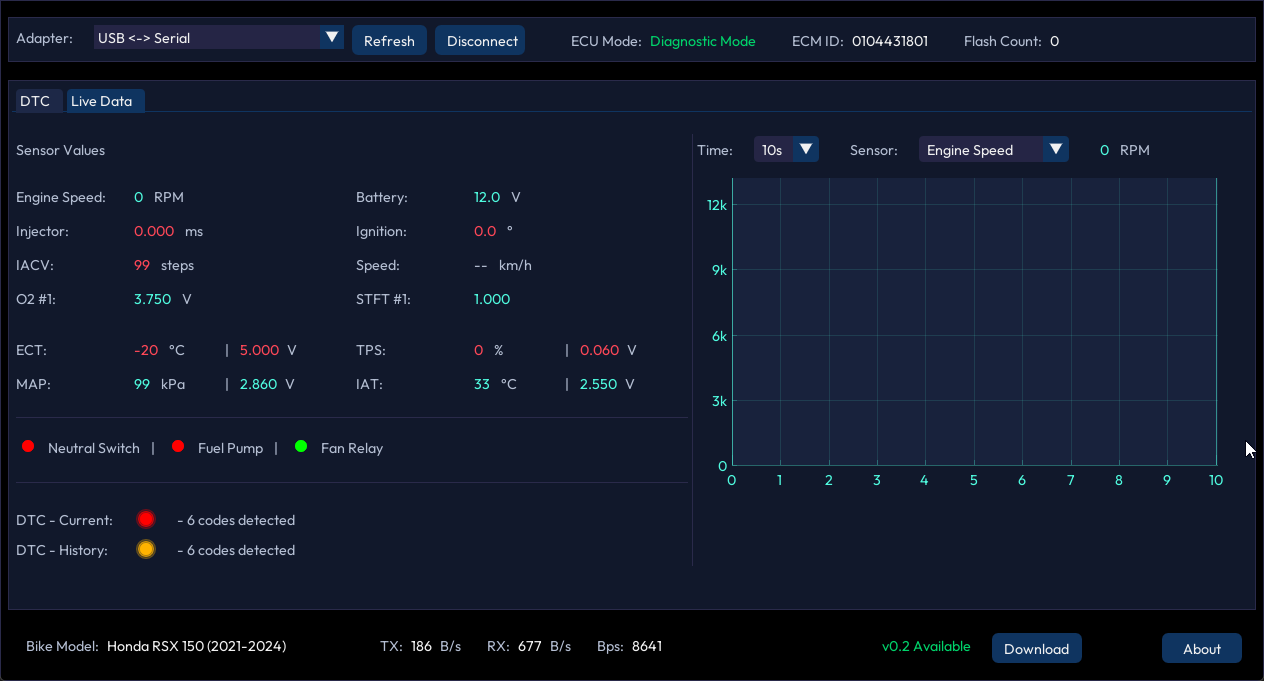
- Wait for Diagnostic Mode Once the handshake completes, the mode changes to "Diagnostic Mode". ECM ID and Flash Count populate automatically.
To disconnect, simply click the Disconnect button. The device list auto-refreshes after disconnection.
Understanding ECU Modes
The ECU Mode indicator in the header bar reflects the current state of the connection:
| Mode | Meaning |
|---|---|
| Disconnected | No active session with the ECU. |
| Initializing… | K-Line handshake is in progress. |
| Ignition Off | ECU is detected but the ignition switch is OFF or the kill switch is active. |
| Diagnostic Mode | Normal connected state. Live Data and DTC features are fully available. |
Features
Live Data
The Live Data tab displays real-time sensor readings from the ECU. The screen is split into two panels:
| Panel | Description |
|---|---|
| Data Panel (Left) | Text grid showing all sensor names, values, and units. Updates in real-time. |
| Graph Panel (Right) | Two interactive plots for visual trend analysis. Helps catch intermittent sensor dropouts or noise over 5–30 second windows. |
Available Sensors
| Sensor | Unit | Description |
|---|---|---|
| Engine Speed | RPM | Current engine revolutions per minute |
| TPS | % / V | Throttle Position Sensor (percentage + voltage) |
| ECT | °C / V | Engine Coolant Temperature (temperature + voltage) |
| IAT | °C / V | Intake Air Temperature (temperature + voltage) |
| MAP | kPa / V | Manifold Absolute Pressure (pressure + voltage) |
| Battery | V | Battery voltage |
| Injector | ms | Injector pulse duration |
| Ignition | ° | Ignition advance angle |
| IACV | steps | Idle Air Control Valve position |
| Speed | km/h | Vehicle speed (on supported models) |
| O2 Sensor | V | Oxygen sensor voltage |
| STFT | — | Short-Term Fuel Trim |
| Neutral Switch | state | Gear neutral indicator (ON/OFF) |
| Fuel Pump | state | Fuel pump relay (ON/OFF) |
| Fan Relay | state | Radiator fan relay (ON/OFF) |
DTC (Diagnostic Trouble Codes)
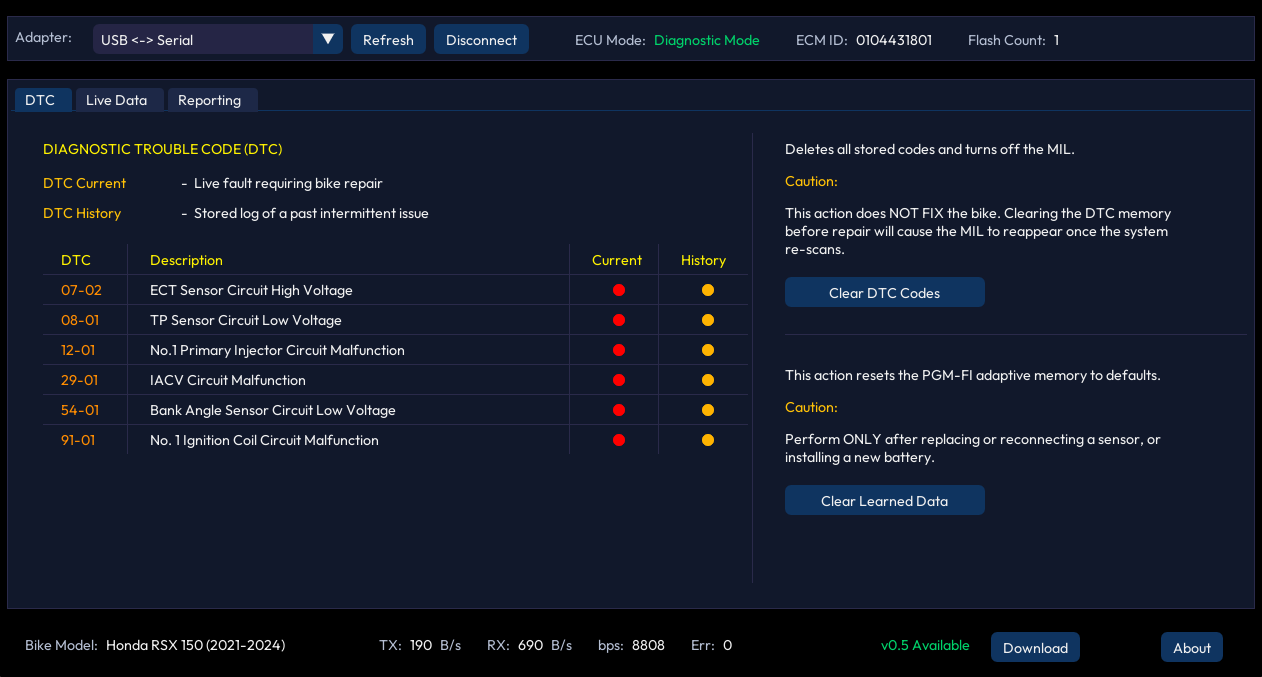
The DTC tab lets you read and manage fault codes stored in the ECU.
Reading DTCs
When connected in Diagnostic Mode, fault codes are automatically retrieved and displayed in a table. Each code shows its ID and a plain-English description of the fault.
The system distinguishes between:
- Current Faults — Active problems happening right now.
- History Faults — Past intermittent issues stored in ECU memory.
Clearing DTCs
After completing a repair, click the Clear DTCs button to erase stored fault codes and turn off the MIL (warning light).
Resetting Learned Data
Click Reset Learned Data to clear the ECU's adaptive parameters. This is essential after:
- Replacing a sensor (TPS, IAT, ECT, etc.)
- Replacing a battery
- After major service or engine overhaul
Diagnostic Reporting
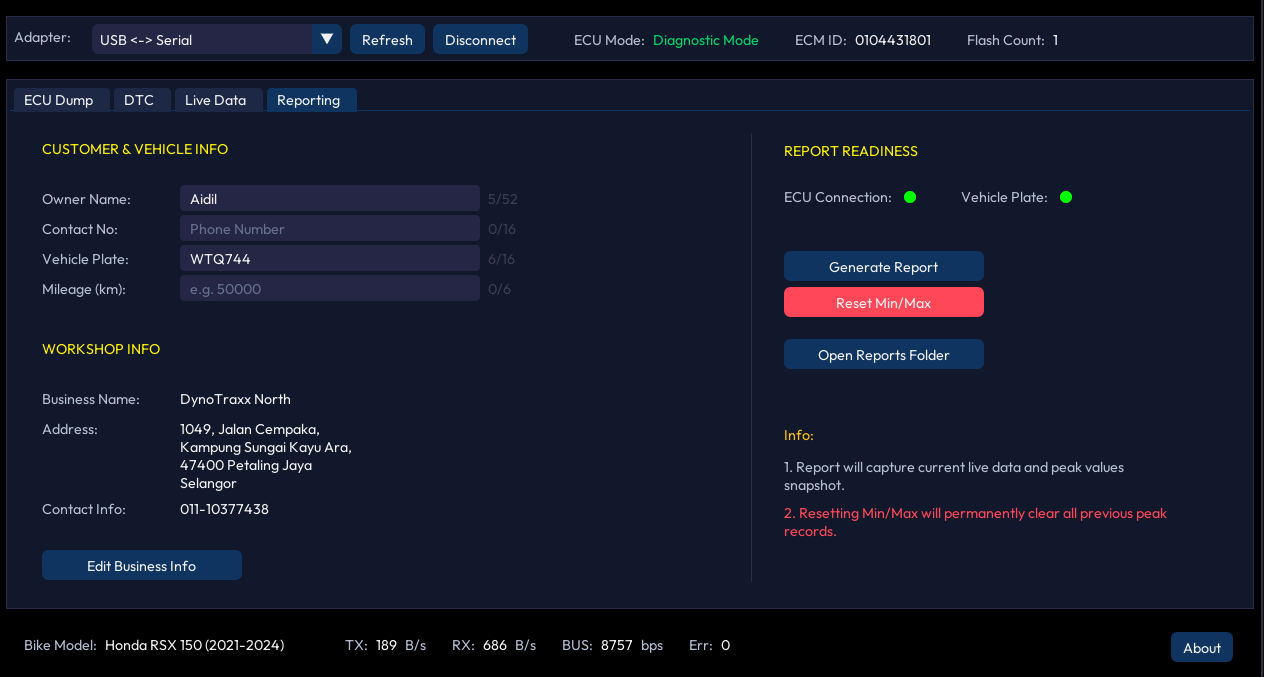
D-Tech Core v0.5 introduces diagnostic reporting, allowing you to generate and save detailed health checks for every bike you service.
- Customer & Vehicle Info Enter the owner’s name, contact, and mileage. These details will appear in the report header. The Vehicle Plate is mandatory; the generate button will remain disabled until it is entered.
-
Workshop Info (One-Time Setup)
Click "Edit Business Info" to set your workshop's name, address,
and contact. This info is saved locally in your
Documents/D-Tech Corefolder and will automatically appear on every report. - Report Readiness The Readiness panel shows two status indicators: ECU Connection and Vehicle Plate. Both must be green before a report can be created.
- Generate Report Click this button to capture a snapshot of the current live data and fault codes. An HTML report will be generated and opened automatically for printing or saving.
- Reset Min/Max This button clears the peak sensor values (fuel trims, RPM peaks, etc.). It’s a critical step before starting a new diagnostic session to ensure fresh readings.
- Open Reports Folder Quickly access all your previously generated diagnostic reports in Windows Explorer. Reports are named by plate number and timestamp.
- Verify Report Opens the online verification portal (https://d-tech.dynotraxx.com/verify/) so mechanics can show customers that the report is authentic.
Auto-Update Notification
D-Tech Core automatically checks for new versions on launch and again after 2 minutes. If a newer version is available:
- A green "v* Available" banner appears in the footer.
- Click the Download button to open the release page in your browser.
An internet connection is required for update checks.
DTC Reference Table
Complete list of Diagnostic Trouble Codes supported by D-Tech Core. When a DTC is active, the corresponding sensor value on the Live Data dashboard will be highlighted in red.
View Full DTC Reference Table (01-01 to 113-01)
| Code | Description |
|---|---|
| 01-01 | MAP Sensor Circuit Low Voltage |
| 01-02 | MAP Sensor Circuit High Voltage |
| 02-01 | MAP Sensor Performance Problem |
| 06-01 | Barometric Sensor Circuit Low Voltage |
| 06-02 | Barometric Sensor Circuit High Voltage |
| 07-01 | ECT Sensor Circuit Low Voltage |
| 07-02 | ECT Sensor Circuit High Voltage |
| 08-01 | TP Sensor Circuit Low Voltage |
| 08-02 | TP Sensor Circuit High Voltage |
| 09-01 | IAT Sensor Circuit Low Voltage |
| 09-02 | IAT Sensor Circuit High Voltage |
| 11-01 | VS Sensor No Signal |
| 12-01 | No.1 Primary Injector Circuit Malfunction |
| 13-01 | No.2 Primary Injector Circuit Malfunction |
| 14-01 | No.3 Primary Injector Circuit Malfunction |
| 15-01 | No.4 Primary Injector Circuit Malfunction |
| 16-01 | No.1 Secondary Injector Circuit Malfunction |
| 17-01 | No.2 Secondary Injector Circuit Malfunction |
| 18-01 | CMP Sensor No Signal |
| 19-01 | CKP Sensor No Signal |
| 21-01 | O2 Sensor Bank 1 Low Voltage |
| 21-02 | O2 Sensor Bank 1 High Voltage |
| 22-01 | O2 Sensor Bank 2 Low Voltage |
| 22-02 | O2 Sensor Bank 2 High Voltage |
| 23-01 | O2 Sensor Bank 1 Heater Malfunction |
| 24-01 | O2 Sensor Bank 2 Heater Malfunction |
| 25-01 | Knock Sensor Circuit Malfunction |
| 25-02 | Knock Sensor Circuit Malfunction |
| 29-01 | IACV Circuit Malfunction |
| 33-02 | ECM EEPROM Malfunction |
| 34-01 | ECV Pot Low Voltage Malfunction |
| 34-02 | ECV Pot High Voltage Malfunction |
| 35-01 | EGCA Malfunction |
| 36-01 | A/F Sensor Malfunction |
| 38-01 | A/F Sensor Heater Malfunction |
| 41-01 | Shiftdrum Angle Sensor Circuit Low Voltage |
| 41-02 | Shiftdrum Angle Sensor Circuit High Voltage |
| 48-01 | No.3 Secondary Injector Circuit Malfunction |
| 49-01 | No.4 Secondary Injector Circuit Malfunction |
| 51-01 | HESD Linear Solenoid Malfunction |
| 54-01 | Bank Angle Sensor Circuit Low Voltage |
| 54-02 | Bank Angle Sensor Circuit High Voltage |
| 56-01 | Knock Sensor IC Malfunction |
| 66-01 | Rear Wheel Speed Sensor No Signal |
| 67-01 | Front Wheel Speed Sensor No Signal |
| 71-01 | TP Sensor 1 Low Voltage |
| 71-02 | TP Sensor 1 High Voltage |
| 72-01 | TP Sensor 2 Low Voltage |
| 72-02 | TP Sensor 2 High Voltage |
| 73-01 | TP Sensors 1 And 2 Voltage Correlation Malfunction |
| 73-02 | TP Sensors 1 And 2 Short Circuit |
| 74-01 | APS 1 (TCP) Low Voltage |
| 74-02 | APS 1 (TCP) High Voltage |
| 75-01 | APS 2 (TCP) Low Voltage |
| 75-02 | APS 2 (TCP) High Voltage |
| 76-01 | APS 1, 2 (TCP) Voltage Correlation Malfunction |
| 77-01 | TBW Return Spring Malfunction |
| 78-01 | TBW Motor Malfunction |
| 79-01 | TBW System Control Correlation Malfunction |
| 82-01 | Fast Idle Solenoid Valve Malfunction |
| 84-01 | CPU In The ECM Malfunction |
| 85-01 | TBW Relay Failure (On Side) |
| 85-02 | TBW Relay Failure (Off Side) |
| 86-01 | Serial Communication Malfunction |
| 88-01 | Evap Purge Control Solenoid Valve Malfunction |
| 89-01 | PAIR Control Solenoid Valve Malfunction |
| 91-01 | No.1 Ignition Coil Circuit Malfunction |
| 92-02 | No.2 Ignition Coil Circuit Malfunction |
| 93-01 | No.3 Ignition Coil Circuit Malfunction |
| 94-01 | No.4 Ignition Coil Circuit Malfunction |
| 99-01 | IMU Circuit Malfunction |
| 103-01 | CAN Communication Malfunction |
| 103-02 | CAN Communication Malfunction |
| 103-03 | CAN Communication Malfunction |
| 103-04 | CAN Communication Malfunction |
| 107-01 | Shift Stroke Sensor Circuit Low Voltage |
| 107-02 | Shift Stroke Sensor Circuit High Voltage |
| 108-01 | Shift Spindle Switch Circuit Low Voltage |
| 108-02 | Shift Spindle Switch Circuit High Voltage |
| 113-01 | Clutch Switch Circuit Low Voltage |
Troubleshooting
App Won't Open (New Install or Update)
Symptoms: You click the D-Tech Core icon, but nothing happens, or an error about "missing DLLs" appears.
Fix: This usually means the required support files were not installed. Go to your extracted installation folder and run these two files:
- CDM2123620_Setup.exe — Installs the FTDI cable drivers.
- VC_redist.x64.exe — Installs the Microsoft C++ Runtimes.
After installing both, try launching the app again.
Adapter Not Detected
Symptoms: The dropdown shows "No devices found" or "FTDI driver not installed".
- Fix: Install the FTDI driver (see Chapter 3.3).
- Check that the USB cable is securely plugged in.
- Try a different USB port.
- Click Refresh in the app.
Connection Fails / Stuck at "Initializing"
Symptoms: The app stays on "Initializing…" and never reaches Diagnostic Mode.
- Verify the DLC wiring — the adapter must be firmly connected.
- Ensure the ignition is ON.
- Check that the correct DLC adapter type is used (4-pin vs 6-pin).
- Try disconnecting and reconnecting.
ECU Mode Shows "Ignition Off"
Cause: The ignition switch is not ON, or the kill switch is active.
Fix: Turn the ignition to the ON position. Ensure the engine kill switch is in the RUN position.
"Unknown Model" in Footer
Cause: The ECM ID reported by the bike is not in the built-in database.
Note: Most diagnostic functions (Live Data, DTC) might still work normally. Only the model name display is affected.
Program Cannot Launch
Fix: Reinstall all three files in your extracted folder to ensure a clean setup:
- Run
D-Tech_Core_v*_Setup.exe - Run
CDM2123620_Setup.exe(Drivers) - Run
VC_redist.x64.exe(Runtimes)
Graph Display Issues
The system targets a 60 Hz display refresh rate. If you are using a monitor with a refresh rate above 100 Hz, the 30-second graph interval may not display data completely. This is a known limitation.
Update Notification Not Appearing
- The app checks twice — on launch and again after 2 minutes.
- An active internet connection is required.
- If the server-side version metadata has not been updated, the notification will not trigger.
Legal & About
Disclaimer
This product is provided "as is" without warranty of any kind, express or implied. DynoTraxx shall not be liable for any damages arising from the use of this product.
All product names, logos, and brands are property of their respective owners. All company, product, and service names used are for identification purposes only. Use of these names, trademarks, and brands does not imply endorsement.
License
License & Version Management
By installing D-Tech Core, you agree to the license terms presented during the installation process. These terms govern your usage rights and any restrictions regarding redistribution or modification.
Automated Version Checks
To ensure you are running the most stable version, D-Tech Core includes an automated check for updates. This process only transmits version strings to verify compatibility; no personal data, project files, or hardware configurations are ever collected or sent to external servers.
User-Controlled Updates
While the application will notify you when a new version is available, you maintain full control over the installation. Updates will not be forced, allowing you to maintain your current environment stability until you are ready to upgrade.