A FREE ECU DIAGNOSTIC TOOL
This tool talks directly to the bike's ECU, so you never have to guess about sensors or electrical issues. It gives you the clear proof you need to show customers exactly what’s wrong. By monitoring sensors in real-time and identifying faults instantly, it’s the simplest way to bring modern diagnostics to your workflow and prove to your customers they’re in capable hands.
D-Tech Core v0.7.1 Release Info
- updated bike library.- minor HTML report update- bus utility optimization to reduce data collision
Get D-Tech Core v0.7.1
Download from GitHub
Extract the ZIP and run the Setup.
If Windows warns about "Unknown Publisher", click "More info" → "Run anyway".
Intel / AMD x64
DIAGNOSTIC KIT REQUIREMENTS
While the software is free, a physical Diagnostic Kit is mandatory. You cannot communicate with the bike or view live data without the correct hardware setup.
Windows 10/11 Laptop: A Windows 10 or 11 based laptop acts as the central hardware to run the software and process incoming ECU data.
FTDI OBD2 USB Cable: It is essential that this cable contains the FT232RL FTDI chip.
Honda DLC Adapters: These cables bridge the standard OBD2 16-pin plug to the diagnostic port on your motorcycle.
- 1. Honda DLC Red 6-Pin Connector: For Euro5 compliant and newer models.
- 2. Honda DLC White 4-Pin Connector: For older fuel-injected models.
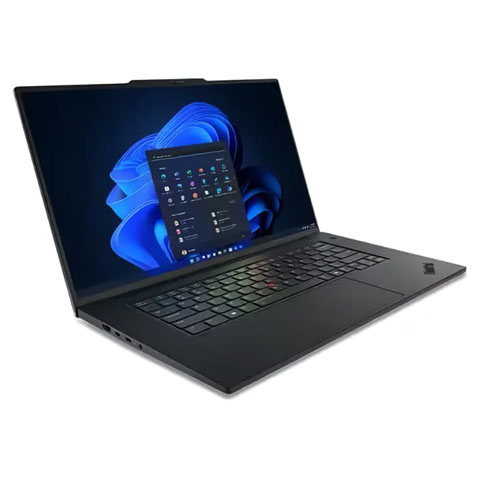 Windows 10/11 Laptop
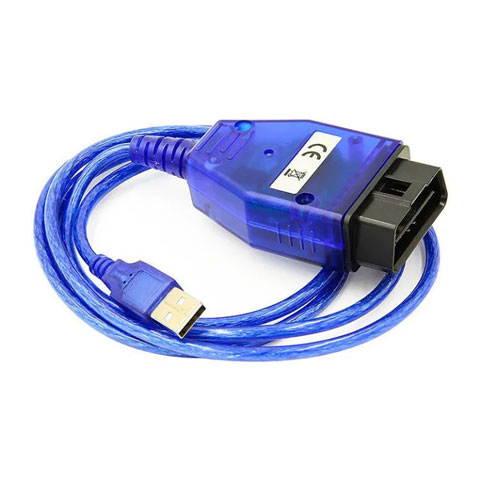 FTDI OBD2 USB Cable
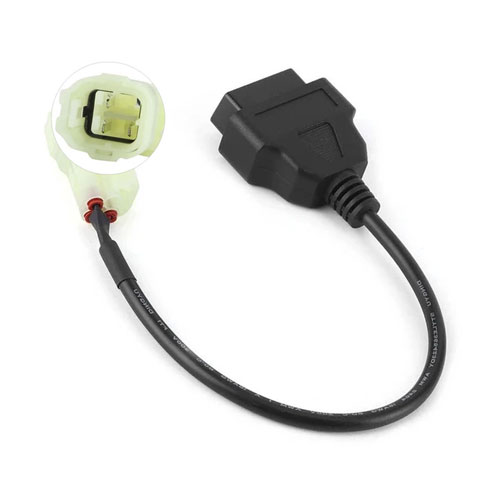 Honda 4-Pin
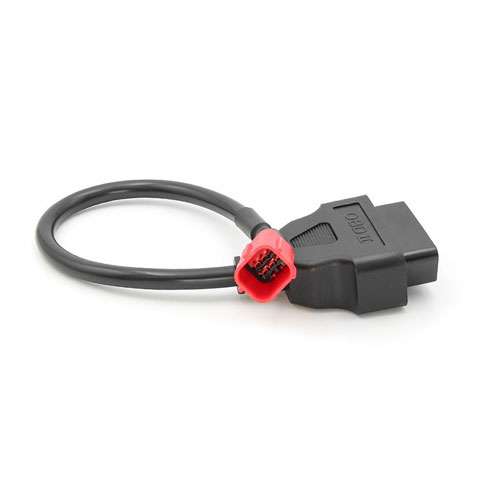 Honda 6-Pin
KEY FEATURES
Diagnostic Reports
Build customer trust with clear, print-ready reports showing their bike's diagnostic information.
Generate structured and print-friendly PDF report by showing active/history DTC logs, live sensor snapshots.
Live Sensor Dashboard
See exactly how the engine is running right now. No guessing.
Real-time monitoring of all critical PGM-FI parameters (RPM, TPS, MAP, Engine Temp, etc.) in a structured grid.
Interactive Data Graphing
Find hidden electrical glitches or sensor stutters that a static screen misses.
Visual analysis of sensor behavior over time (5s to 30s windows) to catch electrical "noise" or intermittent signal drops.
DTC Scanning
Decode engine warning lights.
Translate manufacturer-specific error codes into plain language and trace current and historical fault stored in memory.
DTC Memory Clearing
Turn off the warning light yourself after you finish the repair.
Function to clear stored error codes and turn off the warning light after repairs are completed.
ECU Adaptive Reset
Reset the bike's "memory" so it runs correctly after a part change or cleaning.
Essential after replacing a sensor, cleaning the throttle body, major service or engine overhaul.
Calibrated Sensor Reading
See correct sensor data values (Celsius, Volts, kPa, %).
Translates ECU responses into accurate, formatted diagnostic units.